Hyatt’s devastating devaluation, along with its annual depressing category changes, is scheduled to slam us on May 20th. Now that we have complete award chart details (found here), I analyzed the changes to find out just how bad the future World of Hyatt may be. The good news is that I found a few (very few) bright spots in this bleak new landscape…
What’s changing? What’s not?
Changing
- 3-tier to 5-tier award pricing: In the old system, award pricing was based on a three-tier system: off-peak, standard, and peak. With the new system, there will be five tiers: lowest, low, moderate, upper, and top.
- Increased award prices: With few exceptions, middle and top award prices will increase. You’ll find much more information about this in the analysis below.
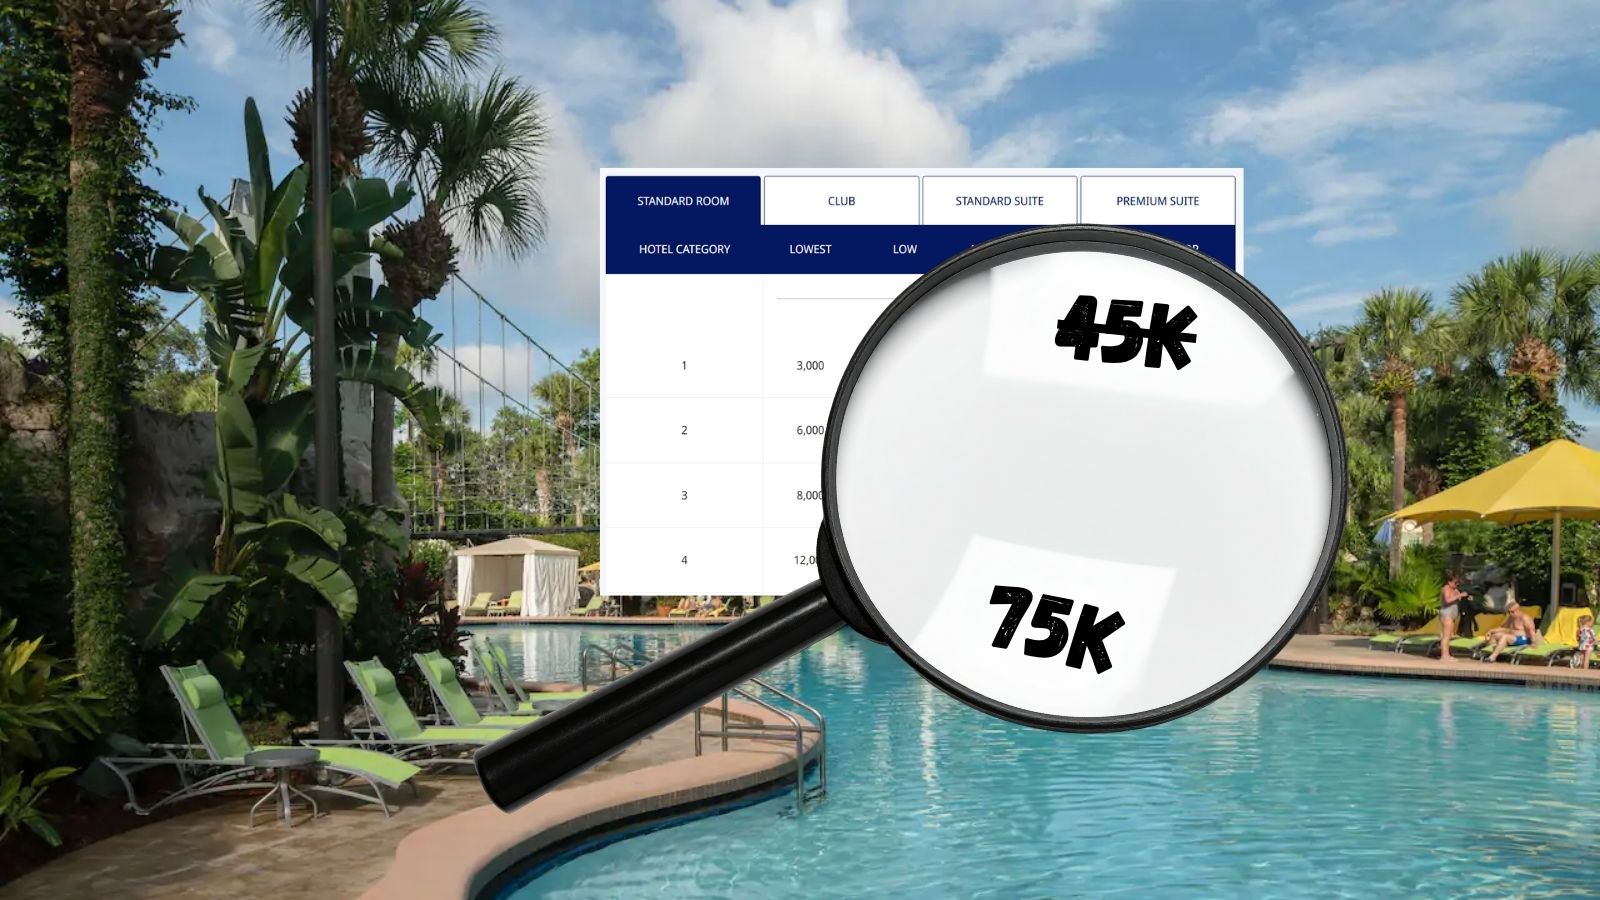
- Wider range between the lowest and highest price tiers: Previously, award prices for standard hotel rooms varied by at most 10,000 points (e.g., Category 8 hotels ranged from 35K to 45K). Now, award prices for standard hotel rooms will vary by up to 40,000 points (e.g., Category 8 hotels will range from 35K to 75K per night).
Staying the same
- Category-based Award Charts: Hyatt will continue to categorize hotels into 8 numbered categories (1-8) and to categorize all-inclusive hotels into 6 alphabetic categories (1-6). Award prices will continue to be determined primarily by the hotel’s category and secondarily by the new pricing tiers (lowest, low, moderate, upper, and top).
- Three sets of award charts: Hyatt continues to maintain separate award charts for Hotels, All-Inclusive Resorts, and Miraval Resorts.
- Points + Cash Awards: Hyatt will still price Points + Cash awards in the same way as before: The points component requires half the points of a regular free night, and the cash component requires half the cash of a regular paid night.
- Room upgrades on paid nights: Hyatt will continue to charge the same number of points for upgrades:
- Club upgrade: 3K points per night
- Standard suite upgrade: 6K points per night
- Premium suite upgrade: 9K points per night
- Free night certificates: Free night certificates will still be usable at any hotel within the categories allowed by the certificate, even when the hotel is priced at the top tier.
Methodology
Three-tier comparison
With Hyatt moving from 3 to 5 pricing tiers for each category, it’s impossible to compare the award charts column by column. Instead, I decided to compare new vs. old based on the lowest, middle, and highest prices. Here’s how the tiers line up with this approach:
| Comparison Level | Old Tiers | New Tiers |
|---|---|---|
| Lowest Price | Off-Peak | Lowest |
| Low | ||
| Middle Price | Standard | Moderate |
| Upper | ||
| Highest Price | Peak | Top |
By comparing old vs. new in this way, I ignored two of the new pricing tiers: “Low” and “Upper.” On the high end, this means that I looked at the worst possible outcome with the new charts, whereas on the low end, I looked at the best possible outcome. There are other reasonable ways to do this comparison, but I believe this option is as good as any.
Three sets of award charts
Hyatt continues to offer separate award charts for Hotels, All-Inclusive Resorts, and Miraval Resorts. My analysis included all of these charts. Within Hotels and All-Inclusive Resorts, the charts are further broken down by Standard Room, Club, Standard Suite, and Premium Suite. I compared all of these chart variations except Club.
Findings
- Bad News:
- Across all charts, the largest devaluations occur at the highest prices. In other words, new Top pricing tends to be significantly higher than old Peak pricing.
- With most categories, the Middle price for a standard room increases by 25% or more.
- With many categories, the Highest prices for a standard room increase by 50% or more.
- The highest price for a Miraval standard room with single occupancy has jumped by 50% (other Miraval increases are significantly less extreme).
- Good News:
- Across all charts, the new Lowest Price is almost always the same or slightly lower than the old Lowest Price.
- Suite pricing shows less inflation than standard rooms for both hotels and all-inclusive resorts.
- Premium suites have the least inflation overall. In many cases with the new charts, the price for a premium suite is only slightly higher than a standard suite.
- Most Miraval price increases are modest (except at the Highest prices)
Award Charts: Hotels
Standard Room Award Chart Changes
| Lowest Price | Middle Price | Highest Price | |||||||
|---|---|---|---|---|---|---|---|---|---|
| Old | New | % | Old | New | % | Old | New | % | |
| 1 | 3.5K | 3K | -14% | 5K | 6K | 20% | 6.5K | 9K | 38% |
| 2 | 6.5K | 6K | -8% | 8K | 10K | 25% | 9.5K | 15K | 58% |
| 3 | 9K | 8K | -11% | 12K | 15K | 25% | 15K | 20K | 33% |
| 4 | 12K | 12K | 0% | 15K | 20K | 33% | 18K | 25K | 39% |
| 5 | 17K | 15K | -12% | 20K | 25K | 25% | 23K | 35K | 52% |
| 6 | 21K | 20K | -5% | 25K | 30K | 20% | 29K | 40K | 38% |
| 7 | 25K | 25K | 0% | 30K | 35K | 17% | 35K | 55K | 57% |
| 8 | 35K | 35K | 0% | 40K | 55K | 38% | 45K | 75K | 67% |
| Avg | -6% | 25% | 48% | ||||||
Standard room pricing gets worse the farther to the right you get on the new charts:
- Lowest Price: The new lowest price is always at least as low as the old lowest price.
- Middle Price: The new middle price averages 25% higher than the old. The worst new middle prices are for category 4 (33% increase) and category 8 (38% increase). The only category with less than a 20% increase was category 7 (17%).
- Highest Price: The new highest price averages a whopping 48% higher than the old. The worst increase overall is category 8 (67%). Categories 2 (58%), 5 (52%), and 7 (57%) are also particularly bad.
Standard Suite Award Chart Changes
| Lowest Price | Middle Price | Highest Price | |||||||
|---|---|---|---|---|---|---|---|---|---|
| Old | New | % | Old | New | % | Old | New | % | |
| 1 | 6.5K | 6K | -8% | 8K | 9K | 13% | 9.5K | 12K | 26% |
| 2 | 11.5K | 11K | -4% | 13K | 15K | 15% | 14.5K | 20K | 38% |
| 3 | 17K | 16K | -6% | 20K | 23K | 15% | 23K | 28K | 22% |
| 4 | 21K | 21K | 0% | 24K | 29K | 21% | 27K | 34K | 26% |
| 5 | 29K | 27K | -7% | 32K | 37K | 16% | 35K | 47K | 34% |
| 6 | 36K | 35K | -3% | 40K | 45K | 13% | 44K | 55K | 25% |
| 7 | 43K | 43K | 0% | 48K | 53K | 10% | 53K | 73K | 38% |
| 8 | 56K | 56K | 0% | 61K | 76K | 25% | 66K | 96K | 45% |
| Avg | -3% | 16% | 32% | ||||||
Standard suites follow the same ugly pattern as standard rooms (where the devaluation gets worse towards the right of the chart), but the devaluation here is not as extreme as with standard rooms:
- Fixed differential from standard rooms: The difference in price between suites and standard rooms hasn’t changed at all. For example, category 3 standard suites cost 8K more than category 3 standard rooms. That’s the same in both the old and new charts:
- Price difference compared to standard room, by category:
- 3K
- 5K
- 8K
- 9K
- 12K
- 15K
- 18K
- 21K
- Price difference compared to standard room, by category:
- Lowest Price: The new lowest price is always at least as low as the old lowest price.
- Middle Price: The new middle price averages 16% higher than the old. The worst new middle prices are for category 4 (21% increase) and category 8 (25% increase). The smallest increase is in category 7 (10%).
- Highest Price: The new highest price averages 32% higher than the old. The worst increase overall is category 8 (45%). Categories 2 (38%), 5 (34%), and 7 (38%) are also particularly bad.
Premium Suite Award Chart Changes
| Lowest Price | Middle Price | Highest Price | |||||||
|---|---|---|---|---|---|---|---|---|---|
| Old | New | % | Old | New | % | Old | New | % | |
| 1 | 7K | 8K | 14% | 10K | 11K | 10% | 13K | 14K | 8% |
| 2 | 13K | 13K | 0% | 16K | 17K | 6% | 19K | 22K | 16% |
| 3 | 18K | 18K | 0% | 24K | 25K | 4% | 30K | 30K | 0% |
| 4 | 24K | 24K | 0% | 30K | 32K | 7% | 36K | 37K | 3% |
| 5 | 34K | 30K | -12% | 40K | 40K | 0% | 46K | 50K | 9% |
| 6 | 42K | 40K | -5% | 50K | 50K | 0% | 58K | 60K | 3% |
| 7 | 50K | 50K | 0% | 60K | 60K | 0% | 70K | 80K | 14% |
| 8 | 70K | 70K | 0% | 80K | 90K | 13% | 90K | 110K | 22% |
| Avg | 0% | 5% | 9% | ||||||
Overall, Premium Suites appear to be one of the few bright spots in the new award charts since most of the premium suite pricing hasn’t increased much:
- New Fixed differential from standard rooms: In the old charts, premium suites are priced at twice the rate of standard rooms. In the new charts, there is instead a fixed number of points per category that are required above the cost of a standard room. For example, in the new chart, category 3 premium suites always cost 10K points more than category 3 standard rooms.
- New award chart, price difference compared to standard room, by category:
- 5K
- 7K
- 10K
- 12K
- 15K
- 20K
- 25K
- 35K
- New award chart, price difference compared to standard room, by category:
- Lower premium over standard suites. Price differences between premium suites and standard suites are much lower than before.
- New award chart, price difference compared to standard suite, by category:
- 2K
- 2K
- 2K
- 3K
- 3K
- 5K
- 7K
- 14K
- New award chart, price difference compared to standard suite, by category:
- Lowest Price: With category 1 premium suites, the lowest price has increased by 1,000 points per night. For all other categories, the new lowest price is at or below the old lowest price.
- Middle Price: The new middle price averages only 5% higher than the old. The worst new middle prices are for category 1 (10% increase) and category 8 (13% increase). Categories 5, 6, and 7 keep the old middle price.
- Highest Price: The new highest price averages 9% higher than the old. The worst increase overall is category 8 (22%). Categories 2 and 7 also have double-digit percentage increases (16% and 14%, respectively).
Award Charts: All-Inclusive Resorts
All-Inclusive Standard Room Award Chart Changes
| Lowest Price | Middle Price | Highest Price | |||||||
|---|---|---|---|---|---|---|---|---|---|
| Old | New | % | Old | New | % | Old | New | % | |
| A | 12K | 12K | 0% | 15K | 20K | 33% | 18K | 25K | 39% |
| B | 17K | 15K | -12% | 20K | 25K | 25% | 23K | 35K | 52% |
| C | 21K | 20K | -5% | 25K | 30K | 20% | 29K | 40K | 38% |
| D | 25K | 25K | 0% | 30K | 35K | 17% | 35K | 55K | 57% |
| E | 35K | 35K | 0% | 40K | 55K | 38% | 45K | 75K | 67% |
| F | 42K | 45K | 7% | 50K | 65K | 30% | 58K | 85K | 47% |
| Avg | -2% | 27% | 50% | ||||||
Once again, standard room pricing gets worse the farther to the right you get on the new charts:
- Lowest Price: With category F, the lowest price has increased by 3,000 points per night. For all other categories, the new lowest price is at or below the old lowest price.
- Middle Price: The new middle price averages 27% higher than the old. The worst new middle prices are category A (33% increase), category E (38%), and category F (30% increase). The only category with less than a 20% increase is category D (17%).
- Highest Price: The new highest price averages a whopping 50% higher than the old. The worst increase overall is category E (67%). Categories B (52%), D (57%), and F (47%) are also particularly bad.
All-Inclusive Standard Suite Award Chart Changes
| Lowest Price | Middle Price | Highest Price | |||||||
|---|---|---|---|---|---|---|---|---|---|
| Old | New | % | Old | New | % | Old | New | % | |
| A | 21K | 21K | 0% | 24K | 29K | 21% | 27K | 34K | 26% |
| B | 29K | 27K | -7% | 32K | 37K | 16% | 35K | 47K | 34% |
| C | 36K | 35K | -3% | 40K | 45K | 13% | 44K | 55K | 25% |
| D | 43K | 43K | 0% | 48K | 53K | 10% | 53K | 73K | 38% |
| E | 56K | 56K | 0% | 61K | 76K | 25% | 66K | 96K | 45% |
| F | 70K | 66K | -6% | 80K | 86K | 8% | 90K | 106K | 18% |
| Avg | -3% | 15% | 31% | ||||||
Standard suites follow the same ugly pattern as standard rooms (where the devaluation gets worse towards the right of the chart), but the devaluation here is not as extreme as with standard rooms:
- Fixed differential from standard rooms: The difference in price between suites and standard rooms hasn’t changed at all. For example, category C standard suites cost 15K more than category 3 standard rooms. That’s the same in both the old and new charts.
- Lowest Price: The new lowest price is always at least as low as the old lowest price.
- Middle Price: The new middle price averages 15% higher than the old. The worst new middle prices are for category A (21% increase) and category E (25% increase). The smallest increase is in category F (8%).
- Highest Price: The new highest price averages 31% higher than the old. The worst increase overall is category E (45%). In particular, categories B (34%) and D (38%) are particularly bad.
All-Inclusive Premium Suite Award Chart Changes
| Lowest Price | Middle Price | Highest Price | |||||||
|---|---|---|---|---|---|---|---|---|---|
| Old | New | % | Old | New | % | Old | New | % | |
| A | 24K | 24K | 0% | 30K | 32K | 7% | 36K | 37K | 3% |
| B | 34K | 30K | -12% | 40K | 40K | 0% | 46K | 50K | 9% |
| C | 42K | 40K | -5% | 50K | 50K | 0% | 58K | 60K | 3% |
| D | 50K | 50K | 0% | 60K | 60K | 0% | 70K | 80K | 14% |
| E | 70K | 70K | 0% | 80K | 90K | 13% | 90K | 110K | 22% |
| F | 85K | 80K | -6% | 100K | 100K | 0% | 115K | 120K | 4% |
| Avg | -4% | 3% | 9% | ||||||
Overall, Premium Suites appear to be one of the few bright spots in the new award charts since most of the premium suite pricing hasn’t increased much:
- New Fixed differential from standard rooms: In the old charts, premium suites are priced at twice the rate of standard rooms. In the new charts, there is instead a fixed number of points per category that are required above the cost of a standard room. For example, in the new chart, category C premium suites always cost 20K points more than category C standard rooms.
- Lower premium over standard suites. Price differences between premium suites and standard suites are much lower than before.
- Lowest Price: The new lowest price is always at least as low as the old lowest price.
- Middle Price: The new middle price averages only 3% higher than the old. Most categories show no change at all. The categories that increase in price are category A (7%) and category E (13%)
- Highest Price: The new highest price averages 9% higher than the old. The worst increase overall is category E (22%).
Award Charts: Miraval Resorts
| Lowest Price | Middle Price | Highest Price | |||||||
|---|---|---|---|---|---|---|---|---|---|
| Old | New | % | Old | New | % | Old | New | % | |
| Standard Room – Single Occupancy | 40K | 40K | 0% | 45K | 50K | 11% | 50K | 75K | 50% |
| Standard Room – Double Occupancy | 57.5K | 60K | 4% | 65K | 70K | 8% | 72K | 95K | 32% |
| Standard Suite – Single Occupancy | 65K | 65K | 0% | 75K | 85K | 13% | 85K | 110K | 29% |
| Standard Suite – Double Occupancy | 82.5K | 85K | 3% | 95K | 105K | 11% | 107K | 130K | 21% |
| Premium Suite – Single Occupancy | 95K | 95K | 0% | 105K | 115K | 10% | 115K | 140K | 22% |
| Premium Suite – Double Occupancy | 112.5K | 115K | 2% | 125K | 135K | 8% | 137K | 160K | 17% |
| Avg | 2% | 10% | 29% | ||||||
Miraval price increases are modest except for the highest prices:
- Lowest Price: The new lowest price remains the same for single occupancy but increases by 2,500 points for double-occupancy rooms.
- Middle Price: The new middle price averages 10% higher than the old. Within room types, the increase ranges from 8% to 13%.
- Highest Price: The new highest price averages 29% higher than the old. The worst increase overall is for the standard room, single occupancy (50% increase).
Conclusion
When booking standard rooms starting May 20th, we’ll pay significantly more points than before, except in rare cases where hotels are priced at the lowest level. In a way, this makes free night certificates more valuable, since they should work regardless of a hotel’s price level, as long as the hotel is in a category the certificate allows.
Standard Suite prices are slightly less inflated, but only because Hyatt has kept the same pricing scheme as before: standard suites cost a fixed number of points (which varies only by category) above standard rooms. Since there hasn’t been an increase in this differential, the devaluation hits standard suites a bit less than standard rooms.
The one surprise bright spot in the new award charts is how little Premium Suite pricing has increased. In fact, in many cases, premium suites will now cost only a few thousand points per night more than Standard Suites. Going forward, if you were planning to splurge for a Standard Suite, it may make sense to go all the way up to a Premium Suite, when available.


On paid stays, the effective reward rate for a Marriott Platinum is:
15X x 0.7 cpp = 10.5 percent
For a Hyatt Globalist to match that reward rate, Hyatt points must be worth:
10.5 percent / 6.5X = 1.615 cpp
For paid stays, the playing field seems level.
/ / / /
On co-branded card usage:
Marriott 2X x 0.7 cpp = 1.4 percent
Hyatt 1X x 1.615 cpp = 1.6 percent
For co-branded card usage, the playing field seems close enough
/ / / /
Hyatt’s only opportunity seems to be with transferred points. And, Bilt seems to be the best channel.
not really fair to compare globalist to Plat. should be globalist to Titanium. Also the RRV for Marriott is 0.77. So correct calculation:
17.5x x 0.77 cpp = 13.475 % return
Hyatt can’t even match that at 2cpp:
6.5x x 2.0 cpp = 13% return
Obviously Marriott much easier to earn. Nothing has changed there. Hyatt paid return % has always been terrible
Will these changes impact the M&MS properties since they are already priced dynamically?
Probably not. Hyatt doesn’t publish the formula they use for pricing Mr and Mrs Smith hotels, though, so that could change at any time for better or worse.
Time to figure out my vacations for this fall and winter. May be my last chance to use my points for a somewhat reasonable option. Really don’t want to see the new 5 tier chart!
This is really bad. Granted Prem Suites are not that bad. Hyatt was the one redemption our family really enjoyed, Ventana Big Sur, Miraval Tucson, Alila Napa Valley, GH Kaui , Andaz Papagayo. PH Paris etc. I can’t think of staying in a Hilton or Wyndham that is how spoilt we are
Using Ultimate Rewards or organically earning Hyatt points?
I really think Hyatt missed the boat by not increasing earn rates on paid stays. I can understand wanting to make it more punitive for points transfers, but not doing something to meaningfully increase paid stays seems to punish the people that they want to stay loyal. It definitely will continue to push people into a free agency mindset.
Totally agree! The people who signed up for Multiple Chase INKs, screwed Hyatt up for everyone else!
Hyatt making the Hilton devaluations look not so bad was not on my bingo card. So ridiculous.
Greg, how soon after the changes will you guys be able to do a meaningful Gondola data evaluation to see the new RRV? Thanks!
I think it should be pretty quick. It’s all up to Gondola to see how quickly they’ll refresh the data.
When Your Points Balance Starts Looking Like the End of the Universe
If you’ve been in this game long enough, you’ve felt it.
You build up a big balance. You’ve got plans. You’re eyeing that perfect redemption. Then, without much noise, things start to change. Awards cost more. Availability tightens. Fees creep in. Nothing dramatic, just a slow shift.
It reminds me of the idea of the heat death of the universe.
The theory is that the universe doesn’t end with a bang. It just slowly runs out of usable energy. Everything spreads out, temperatures level off, and eventually nothing meaningful can happen anymore. No movement, no excitement, no big moments. Just a long, quiet drift into sameness.
That’s what points devaluations feel like.
At first, your miles have a ton of potential energy. They can take you somewhere incredible. First class to Japan. A suite in Paris. Real experiences with real value. But over time, that potential gets diluted. Programs tweak pricing. Partners disappear. Dynamic charts creep higher. The same balance just doesn’t do what it used to.
It’s not that your points disappear. It’s that their usefulness slowly fades.
Just like energy in the universe, your points spread out across higher prices, fewer sweet spots, and more restrictions. The system moves toward equilibrium where everything costs more and the outsized value gets harder and harder to find.
And the key part here is that it’s one direction.
There’s no sudden reset where everything gets cheaper again. No moment where the value snaps back. It just keeps drifting.
That’s why holding points for too long is risky. You’re essentially watching their usable energy fade. What once could have been a great redemption turns into something average. Then eventually, just fine.
So the takeaway is simple.
Use your points while they still have energy. Turn them into something real while they still create movement and excitement. Because if you wait long enough, you’re not losing your points.
You’re losing what they can do.
And in this game, that’s the closest thing we have to the end.
You forgot: And, then we die.
Felt this in my soul. Don’t hoard points.
Points are like Fiat currency. The banks and airlines print them (offers 150K, 200K, 300K ) etc and then the value diminishes.
An effective 33% devaluation is lousy (and I think i’m being generous with that estimate) but the real effect is that transferring Chase points over in most cases no longer gets you 2c/pt, it gets you 1.3c/pt. Which is below the threshold people at which should want to do that transfer. I certainly wouldn’t, given the relative lack of differentiation of Hyatt hotels from alternatives and the limited footprint. Will this start a death spiral as a major source of revenue (banks buying hyatt points) tanks and Hyatt is forced to reduce cash rates to incentivize bookings which in turn further devalues point values and in the end it’s left with… a limited footprint of properties without much to make up for that limited footprint?
There’s no question that the evaluation is lousy. We won’t know the average redemption value of Hyatt points though, until after the new charts are in effect. Hyatt has control over how the hotels are mapped into the tiers and I’m pretty sure they want to keep a high average value for their points. My bet is that we’ll be looking at closer to 1.5 or 1.6 cents per point on average.
This is gonna be the big question for me. I mostly book Tier 1 and 2 Hyatts right now with the occasional “fancy” booking. If they price at the middle price, fine – I can accept paying 10,000 points instead of 8,000 points for a Tier 2 Hyatt Place. But if I’m suddenly being asked to pay 15K for a $200/night hotel instead of 9,500 point, I simply won’t do it.
Hilton points are a lot easier to come by, and I’m just as happy at a Hampton Inn or Embassy Suites as I am at a Hyatt Place.
It remains to be seen how I will value Hyatt points going forward. But, if the CPP drops to below 1.5 CPP, I don’t see how this could possible be viable.
Same. My favorite Hyatt is a Cat 2 that often prices at $250-300, but is also rarely at Peak, so my 8k points are very valuable (and better value than the Holiday Inn down the street). If it suddenly becomes 15k points, I’ll simply switch to the Holiday Inn and move on with my life.
And in my view, CPP for Hyatt Places should be calculated based on equivalent IHG, Hiltons, or Marriotts, not Hyatt Place pricing. Hyatt’s cash rates are often inflated compared to their competitors. I’m equally happy at a Holiday Inn Express, Hampton Inn, or Residence Inn as I am at a Hyatt Place as long as they are clean and safe. For those of us who will never hit Globalist, there’s no motivation to stay Hyatt loyal if they basically double the cost to book. I hope that Standard will map to Moderate, but I’m not holding my breath.
Hyatt Places seem overpriced because many consumers incorrectly think they are materially better than, say, a Holiday Inn Express. Of course, this is currently the most successful business strategy in America: offer (or be perceived as offering) a slightly elevated product and price it significantly higher. Any American who actually wants value in their hotels (and who isn’t playing the credit card game) should just look at reviews and book the hotel that offers the best combination of quality, price and location for their needs.
Despite Hyatt previously being the darling of the hotel redemption world, the reasons you listed are why I’ve rarely stayed at Hyatts. There was almost always another property available where at worst, I could cash out UR (if I wanted to) and buy the points to stay somewhere cheaper that was also often better-located. Maybe the property tiers weren’t the same (Park Hyatt vs Holiday Inn Express) but I’m totally fine saving significant amounts of points/cash to stay somewhere that’s comfortable enough when I’m out exploring the city all day and only using the hotel to sleep.
Right. It’s always better to splurge on resorts — where being at the hotel is a major part of the stay — than splurge on city hotels. I don’t stay at Park Hyatts or even Grand Hyatts on points in countries (like the USA) where hotels are expensive. Once you get to 3-star quality (clean and comfortable), location becomes more important than frills. I’m actually not sure who generates enough points to be able to book 35,000/night city hotel stays just because they’re a bit fancier.
Totally agree we’ll need to see what the real rates are (well, except they’ll be at least 25% worse). That said, Hyatt controlling what tier a hotel is in *used* to be effective, but it’s definitely not anymore with these massive fluctuations within a tier and their explicitly stating that they’re not going to limit hotels from setting their prices however they want (within that massive range). And to make a long point short, while 1.5c/pt might well still be achievable with cherrypicking… is it going to be 1.5c/pt compared to the 5 equivalent non-hyatt properties in the area? Seems unlikely, so you’re using those points at maybe 1.2c vs the alternative. Maybe not everyone maths like us, but is the newbie going to rush to send 70k pts over to Hyatt to stay in a HP instead of paying cash for a HIE? I imagine they’ll hold those URs for the Emirates flight they’ll never take then settle on some depressing PY on United.
To me, geographic footprint is one of the biggest limitations of Hyatt. Adherents rationalize inconvenient locations as “Oh, it’s not that bad” in the name of the almighty cents per point redemption. Or, the specific property isn’t what you’re looking for “Oh, it’s good enough.” While these issues (and others) affect all members, they are particularly accentuated for someone who is looking for luxury experiences. Years ago, I decided that I wasn’t going to do that to myself.
Sure, there will be Hyatt properties that one can cherry-pick. But, I think the take-away is that free agency will better serve Hyatt adherents going forward.
And, one can’t help but wonder whether Globalist benefits will ultimately be watered down, leaving a person asking “why the heck am I doing this” when striving for tier status.
I tend to agree with you if you’re mostly paying your own way to stay at hotels. Then free agency is best. But if somebody else is paying for your hotels, or you’re gaming credit card points, there can still be good value in the Hyatt program (mostly for those who do international travel).
Cherry picking is the name of the game for me. For example, Wyndham has devaluated multiple times in the last 6 years, affecting my favorite properties. Yet it has not affected my redemption CPP much (2 CPP or higher), because I do what I always do: pick the best values that I actually want to visit, and use my points there. If a property is no longer a good value, I simply move on to better values, in any program. It does mean a shrinking list of good values, but with multiple programs in existence, I still find some.
True. The problem with the Hyatt program (unlike, say, Wyndham) is that the number of aspirational USA hotels they still offer at an attractive award price is getting pretty small. It may still work for a one-time redemption, but it may not work if you’re shooting for Globalist status — which, of course, makes those aspirational redemptions much more fun and better value.
The cruise industry wishes to thank the hotel and airline industries for all the business they have sent them after those industries jacked up their rates.
Yeah, but half of cruisers fly to the embarkation port. Also, cruise lines are doing fuel surcharges.
Greg, here you seem to assume off peak will map to lowest. Isn’t it quite possible they mostly map to low?
Absolutely. But it’s also possible (unlikely but possible) that most Peak will map to Upper instead of Top. It’s also likely that many Standard will map to Low or Upper instead of Moderate. There’s no way to know. I picked one mapping that I thought balanced things out reasonably by being optimistic on the low end and pessimistic on the high end. That doesn’t mean it’s the right mapping!
The thing is: they can do whatever they want now. They can use one mapping initially, you write a nice article how things are not that bad, then 6 months later we get Bonvoyed.
Oh wow, you read this as things are not that bad? That’s not how I see the results.
I’m saying, they can not use the top two bands initially and things can look better than expected. Your current article is based on assumptions that are pretty pessimistic but depend on which price bands they use.
The lowest price may be lower than current low season, but Hyatt stated there will be no requirement for a hotel to have even a single day per year available at the lowest rate. So I think that comparison is meaningless. I suspect that currently there might have been a requirement for at a minimum 2 nights a year at low seasonality… just anecdotally based on a couple of my favorites having only 2 random midweek nights a year at low season.
So now it will be a free for all. Hyatt will assign category, but with hotels having complete control of seasonality, the popular ones who view WoH as a burden will likely set rates at higher/highest only.
I don’t think the hotel controls the points pricing – I think it’s Hyatt. The hotel can manage it’s own inventory and cash pricing (with the help of Hyatt’s systems) but Hyatt chooses the points tier. The hotels are reimbursed by Hyatt, not a price per point basis, but on a % of average daily rate based upon occupancy. High occupancy nights – Hyatt reimburses a high % of the daily rate. Low occupancy – Hyatt reimburses a nominal fee. It would be in the hotel’s interest to be as low as possible on tier (within reason) to get occupancy to be as high as possible, since the reimbursement is the same for all.
We’ve seen this issue with SLH hotels for Hyatt and, now, Hilton. The rate is artificially high and then Hyatt/Hilton is required to reimburse a very high percentage of that rate for points bookings because the occupancy is low (some properties like Calala have very few rooms and a higher occupancy then). This is one of the things Hyatt is trying to get away from, in addition to reimbursing “Top” dates for Cat 8 properties under the old system (like a ski resort at Xmas).
I think it’s pretty well established that Hyatt controls the category and the hotel controls the seasonality. What’s uncertain is if Hyatt puts any limits on the hotels. Now I think they do, but they’ve stated that in the future there will be no requirements for the hotel to offer any lowest nights.
I remember reading that the compensation is a function not just of occupancy but also of points occupancy. Hotel is full but it’s all people staying on points (i.e. a points farm) is not going to get compensated as much as a hotel that’s mostly full of cash travelers with a few lucky folks who got to stay there on points.
Additionally I believe that Hyatt (as well as other brands?) has a requirement that if a standard room is available at a standard rate, then it’s available with points.
I believe this creates an incentive structure where when a hotel truly has spare rooms then yes, it would be in the hotel’s interest to be as low as possible on tier.
But when there’s a ton of organic cash demand and the hotel would sell out, the new peak pricing gives hotels tools to drive away points travelers. They’d rather get 100% of the average daily rate rather than 90% or whatever that Hyatt is paying.
Well said, Dr. Toboggan.
For people spending their own money — or transferring Chase points — I think the new redemption prices make it not worthwhile to aim for Globalist status IF they do not do much international travel. The hard truth is that almost all the Hyatt hotels you’d want to stay at in the US will cost too many points. To find affordable aspirational properties, you have to go overseas. A lot of this has to do with the often astronomical cost of US hotels these days. It seems pointless to stay in an endless series of uninspiring US Hyatt Places (with no meaningful Globalist benefits) to get to 60 nights only to have it cost a zillion points to stay at a nice US hotel. You need to want to take your points and stay at nice Hyatts in affordable countries. Otherwise, it’s too much effort for too little reward
Yeah, I get the points from my CC but pretty much the same. I’m going to Nice this summer and it will be incredible with a SUA on 35k. But even then, its basically $500 worth of points/night that I could have cashed out for a hotel I dont really need. If i book the same next year, it will be close ~$750 worth of points. So I would be paying $3k on top of 60 nights of grinding for stay and ENCs from stays. Just not worth it when I could just book a non-chain hotel / airbnb and get 85% of the experience at around the same cash rate without jumping through hoops.